June 2024 - April 2025
Education Analytics
1 Product Owner, 1 Product Manager,
1 Technical Delivery Lead
From Research to Design
Overview
Problems
Challenges with manual and delayed readiness reporting.
College and career readiness reports were only available once a year in printed format.
Student data was manually uploaded from each district, making the process slow and labor-intensive.

Solution
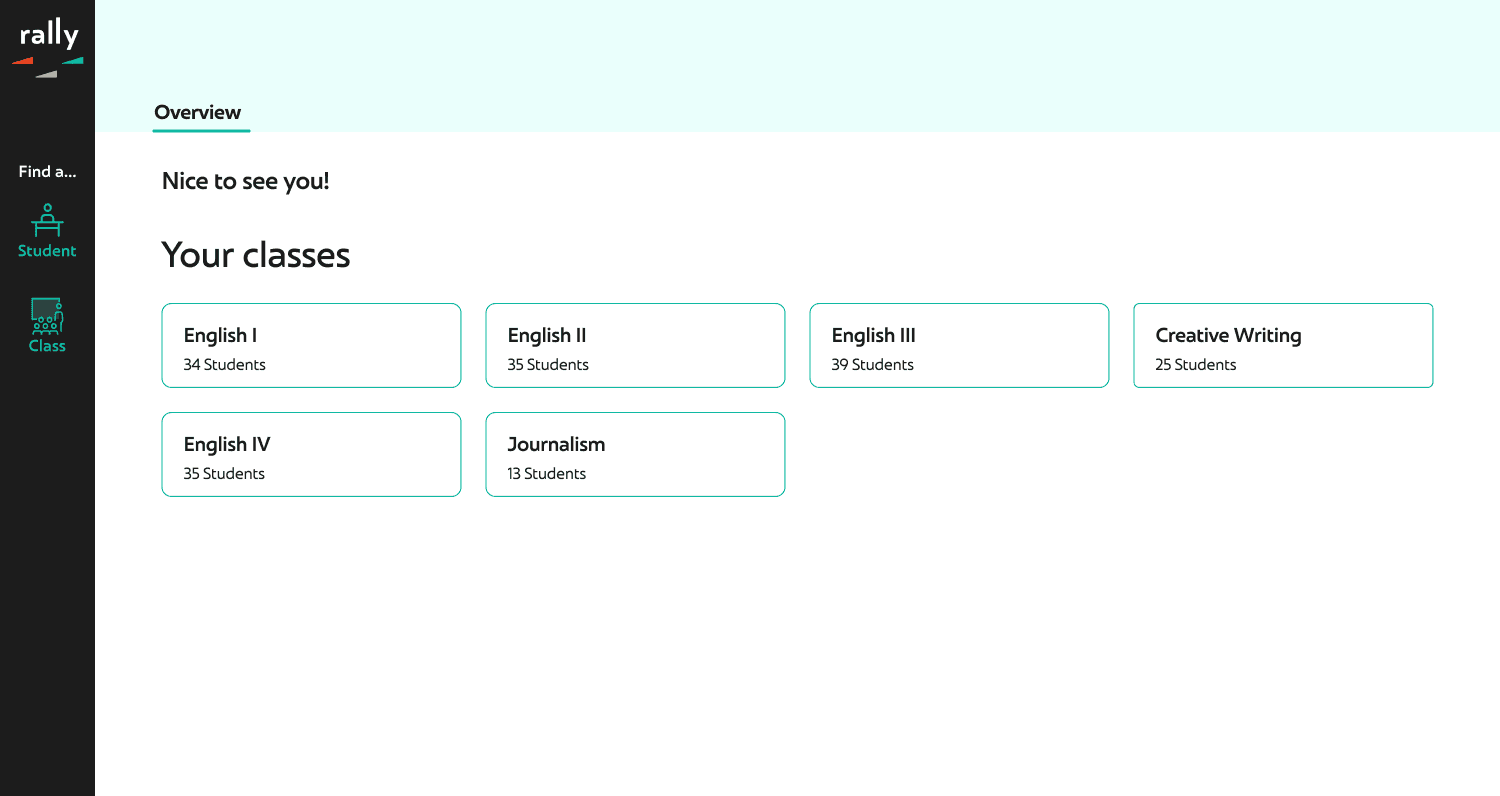
Introduce a College and Career Readiness section within Rally Analytics Platform.
Results
Impacted 8k+ educators across South Carolina
Transformed a 60+ days manual update and analysis workflow into instant and anytime access.
Scheduled to launch in districts across California and Texas.
Prototypes
Research
Stakeholder Interviews
Since there was no initial plan to interview real users, I proactively reached out to stakeholders to gather more insights.
District leaders
Learn how educators currently access relevant data
Prioritize key pain points in data access and decision-making
Product Managers
Align use cases with the overall product strategy
Collaborate on product scope and design goals
Data Analysts
Understand how readiness is measured across districts
Identifying key performance indicators
Data Engineers
Understand data flow from Ed-Fi into the Rally platform
Identify data limitations, frequency, and latency

Secondary Research
I also conducted research on CCR policies and metrics across different states.
Common CCR Indicators
End-of-course examinations
AP/IB course scores
ACT/SAT scores
FAFSA completion
Dual-enrollment courses
State required assessments

User Persona

High School Counselor
User Needs
Quick access to up-to-date student readiness data (e.g., GPA, course completion, test scores).
Clear indicators of which students are on track vs. off track.
Identify at-risk students and take early action.
Design Goal
How might we help educators quickly access students college and career readiness data and identify who is on track or needs support?
Design
Challenge I — How to manage and organize different indicators?

To help educators quickly assess CCR, I created separate 'College Ready' and 'Career Ready' views, with related course and assessment data grouped within each for clarity and context.
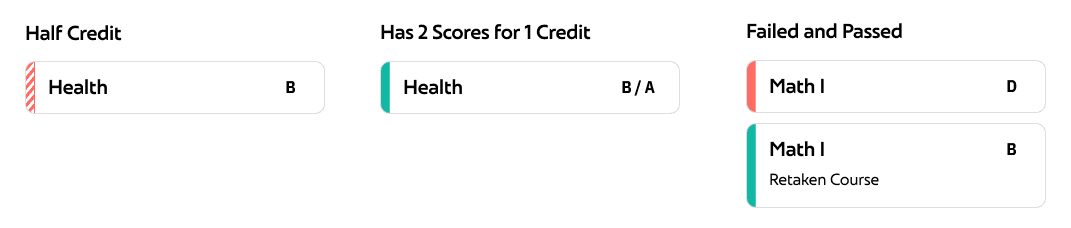
Challenge II — How to effectively visualize large volumes of data within a single CCR indicator?
For example, the course data includes grades, credits, scores, and benchmarks for each subject. I brainstormed various options and collaborated with the team to understand data availability.

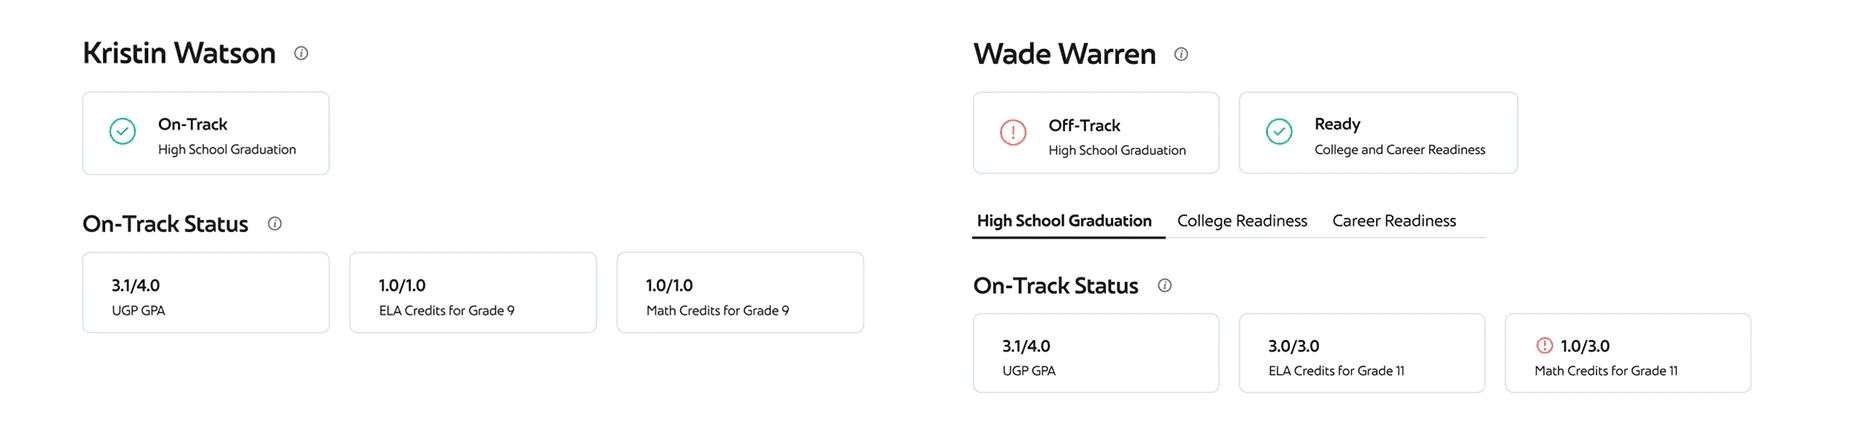
Challenge III — How to enable educators to quickly identify each student's readiness status?

To improve scannability, I explored different color systems and chose a simplified palette that supports quick, clear decision-making.
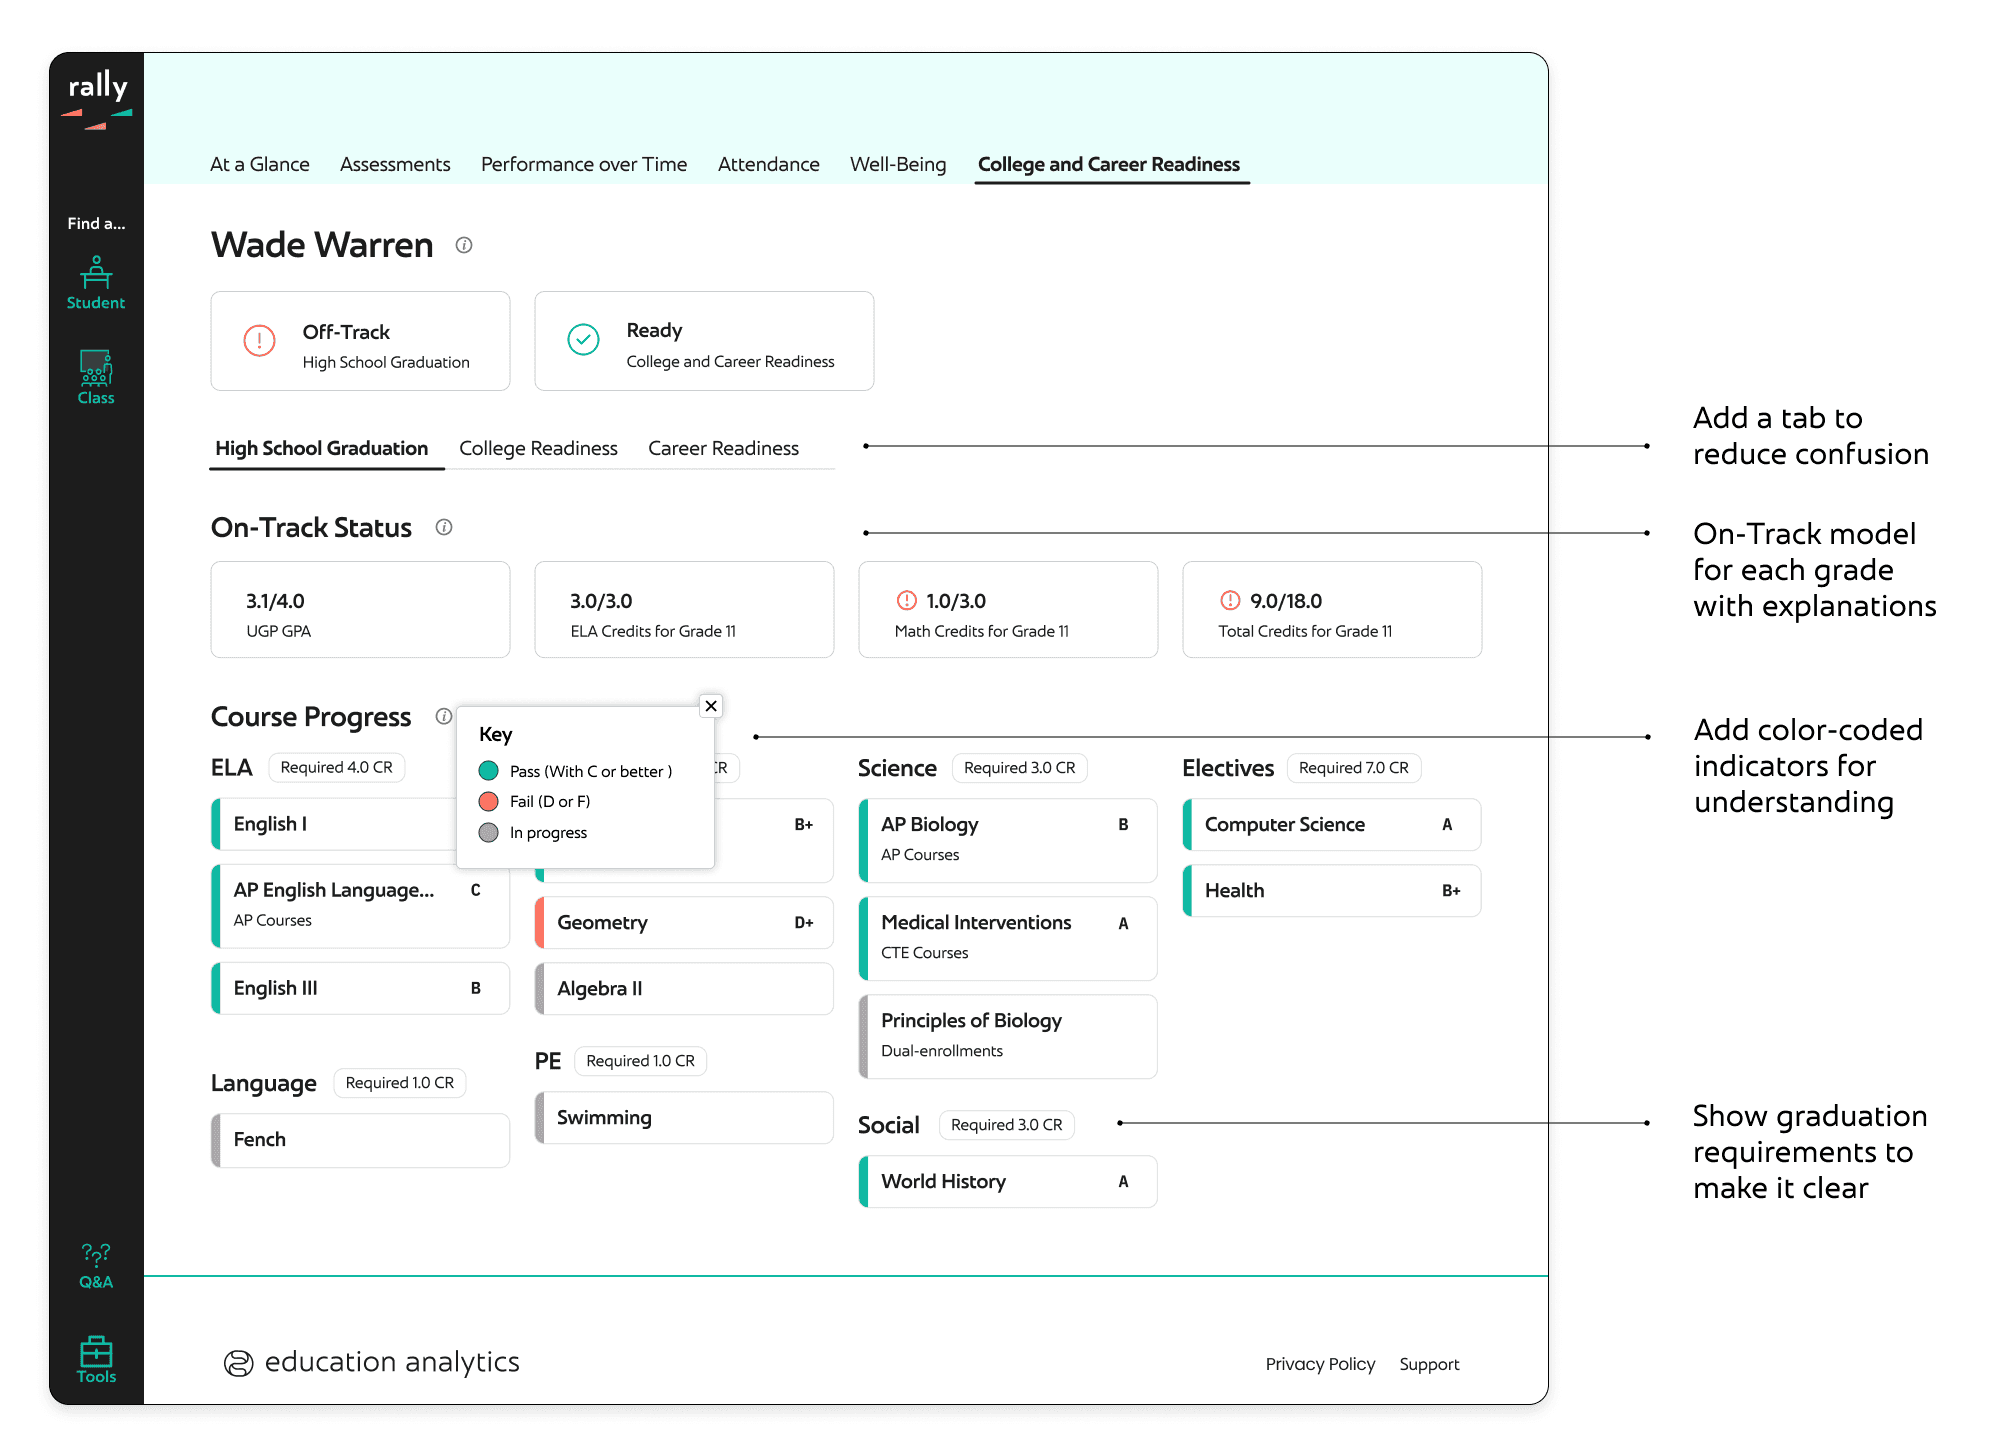
Prototypes
I created a prototype at both the student and class levels to visualize key indicators and clearly highlight pass/fail status for each one, along with overall college and career readiness.

Iteration
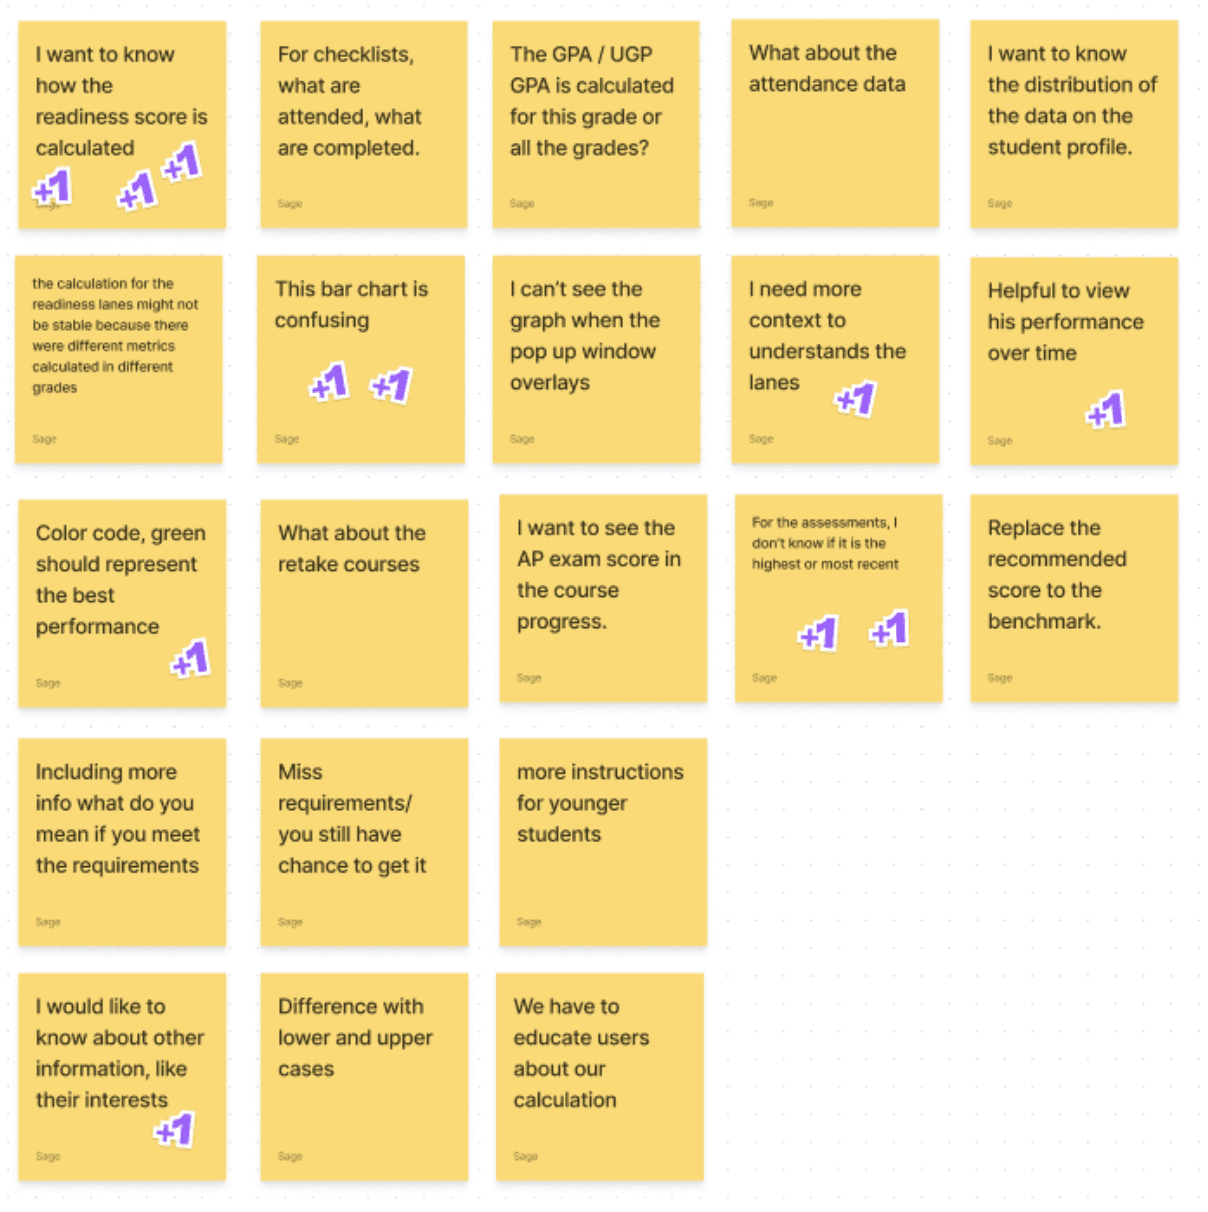
Stakeholder Review
I conducted a stakeholder review session to validate ideas and identify potential issues.
Unclear that the top button is clickable
Desire for grade-specific “On-Track” models
Lack of clarity around state benchmarks
Color coding needs context
Edge cases need to be considered
Interest in additional information